

We connect Michigan State business student talent with top employers.
Our team advises, coaches, and educates business-interested MSU students to realize their career aspirations, while working with leading employers and alumni to send our Spartans across the world.
Services & Resources
At the Russell Palmer Career Management Center, dedicated career advisors offer personalized, forward-thinking support to help MSU undergraduate students launch successful business careers. From one-on-one guidance to a wide range of virtual tools, we provide comprehensive resources that empower students to confidently navigate their career journey.
Access Undergraduate Career AdvisingThe Russell Palmer Career Management Center is dedicated to providing a high level of personalized services to MBA students, specialty master’s students, and employers. We partner with students in connecting their professional aspirations to their future careers through a full suite of services and resources that include support for career planning, networking, resumes, cover letters, interviews and more.
Access Graduate Career AdvisingWe are here to help you develop a customized plan to establish, grow or maintain your company’s presence with Broad graduate and undergraduate students.
Access Employer ResourcesTake a look at our data gathered annually on student outcomes.
View Employment Reports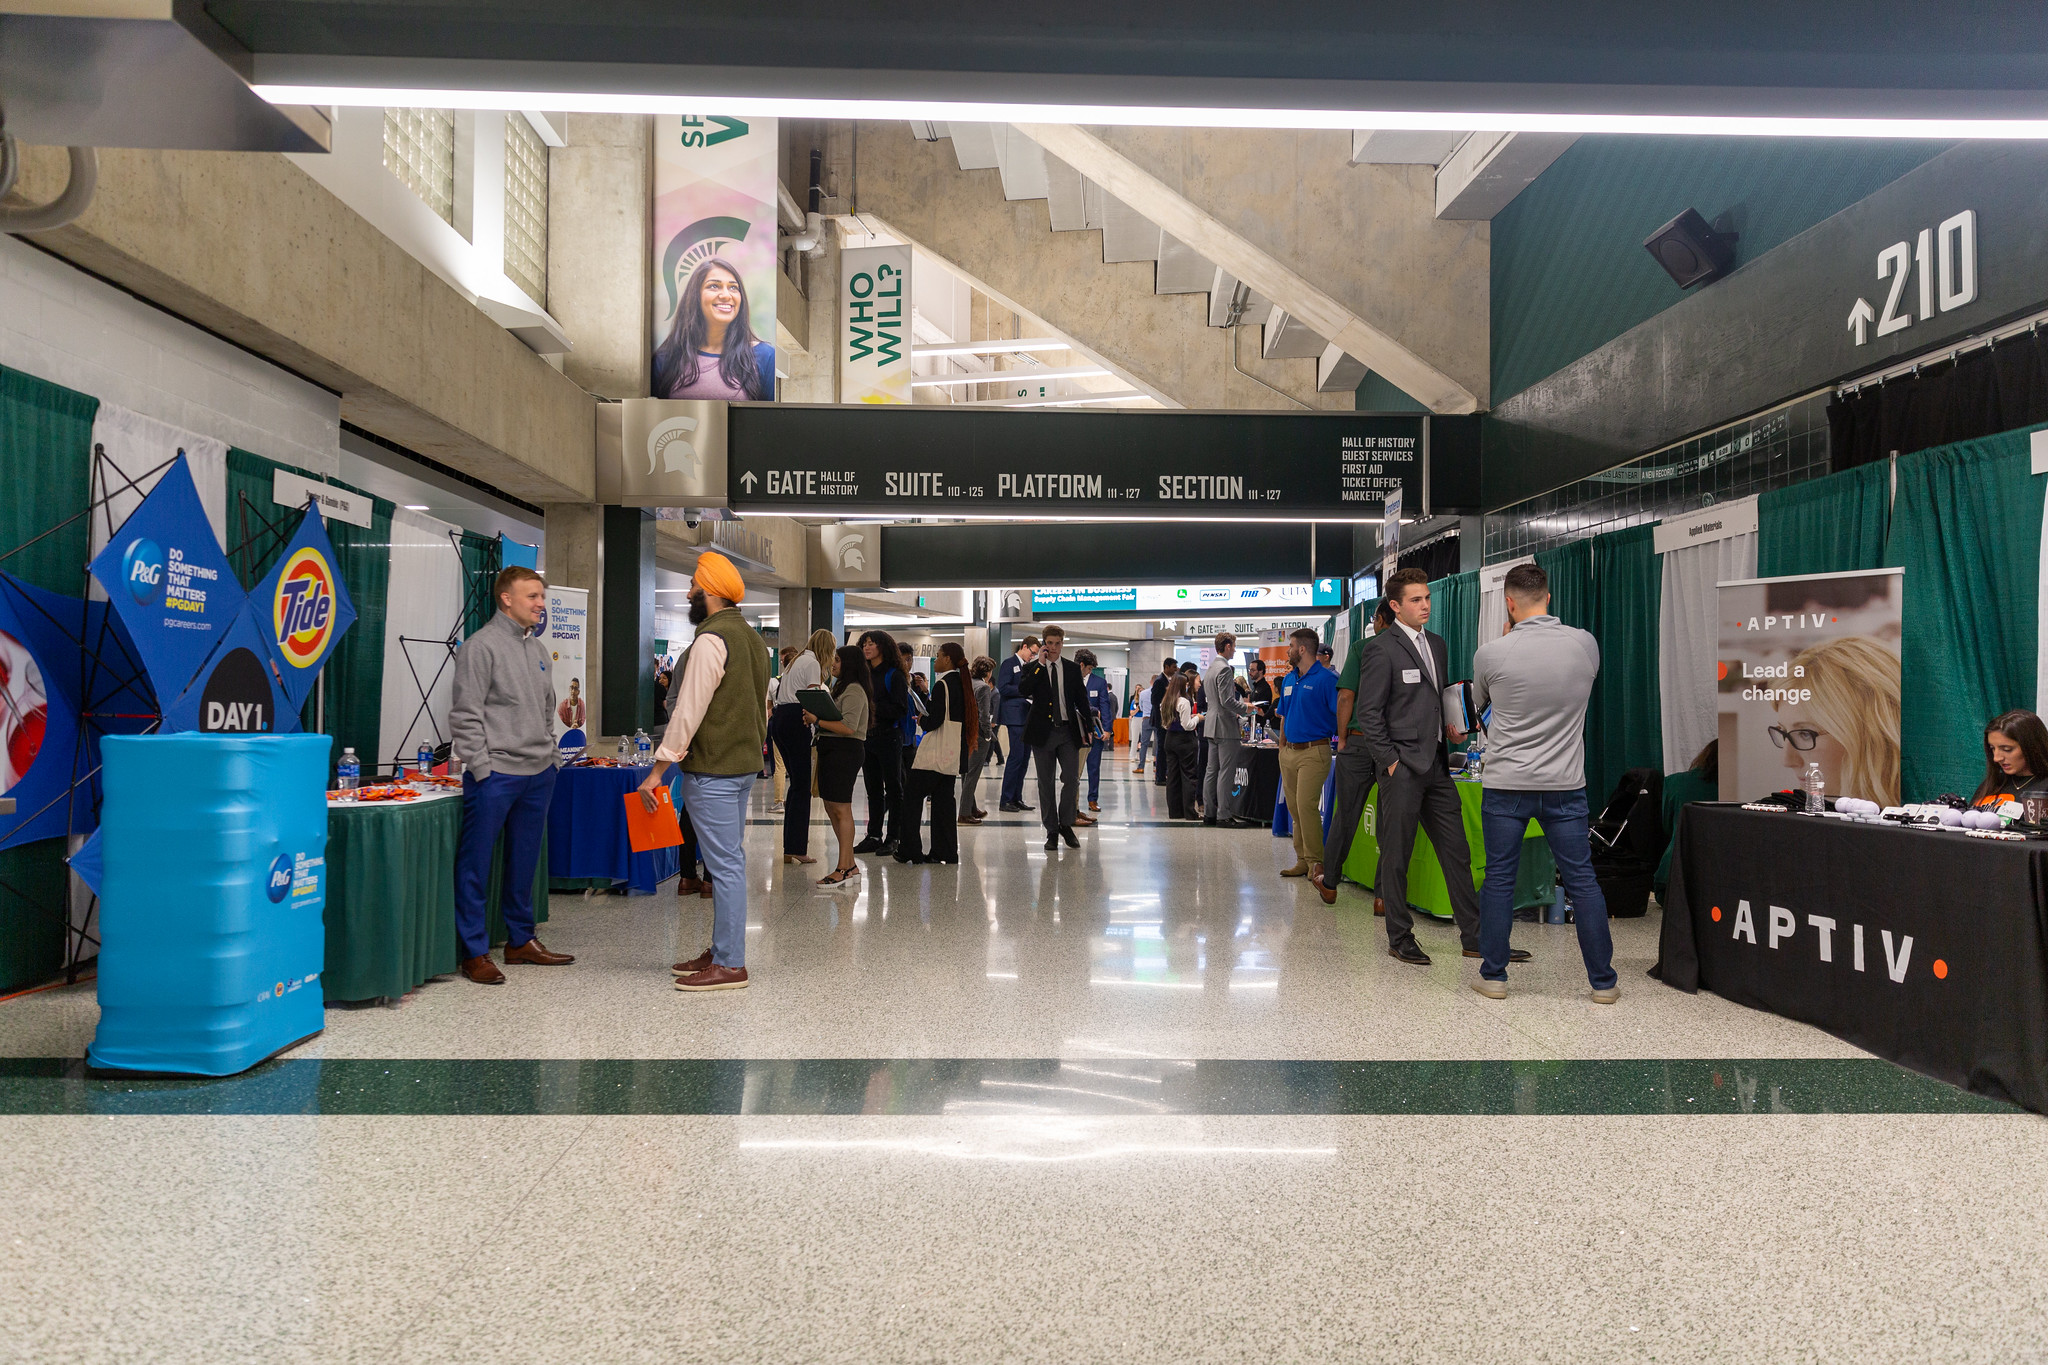
2025–26 Undergraduate Corporate Partners
Our Premier Palmer Partnership Program serves as a dedicated collection of companies that enhance the student experience. Their representatives serve in creating student development resources, assess educational needs, and communicate trends in the labor market. Companies benefit from high visibility while highlighting their strengths and culture through career-related events, interaction, and activities. Our Premier Palmer Partners are below.

"Green and White Glove" Service
In Broad tradition, we strive to provide best-in-class customer service to both our students and employers.
The Russell Palmer Career Management Center is the central career center for the Broad College and part of MSU’s Career Services Network (CSN). The CSN is a seamless connection of career service professionals located in college-based and centralized career centers across campus. We support students with resources, programs and services related to career development. In addition, we also support recruiters by assisting with job postings, information sessions, career fairs, interview rooms and more.
Mission Statement
We enhance student success and development of transformational leaders through:
- Facilitation of proactive lifelong career management skills in a rapidly changing, globalizing and diversifying employer marketplace.
- Formation of strategic partnerships with employers and alumni to enable talent acquisition and development.
- Leading and delivering “green and white glove” strategic support to students, alumni and employers, ensuring our stakeholders’ positive engagement.

Career Stories @ Broad
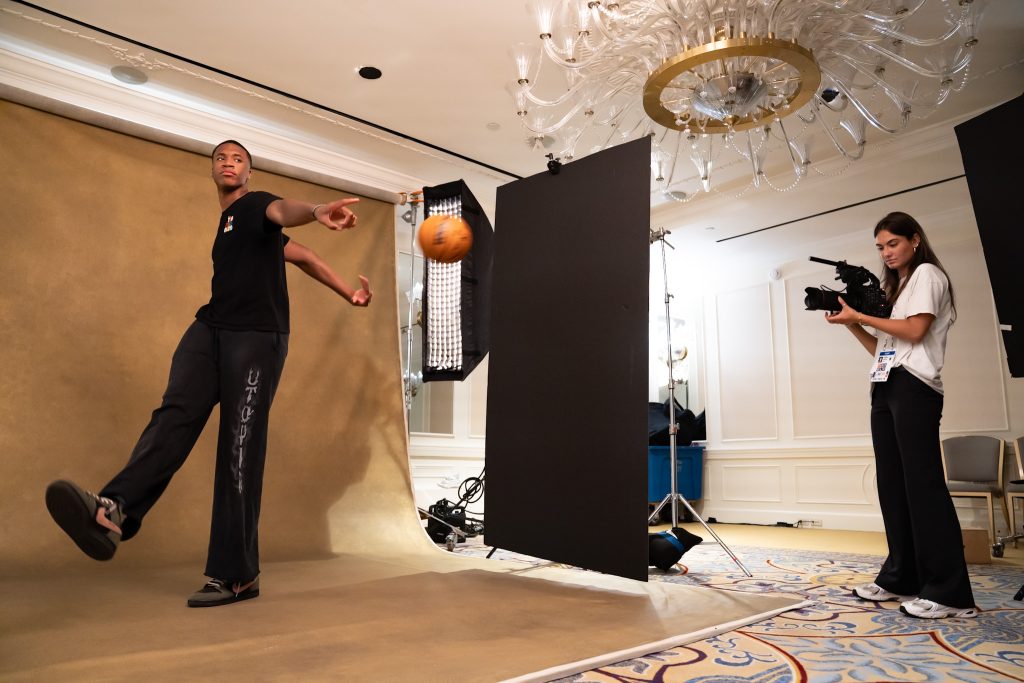
Marketing senior Zophia Roach shares behind the scenes details of her internship with the NBA.

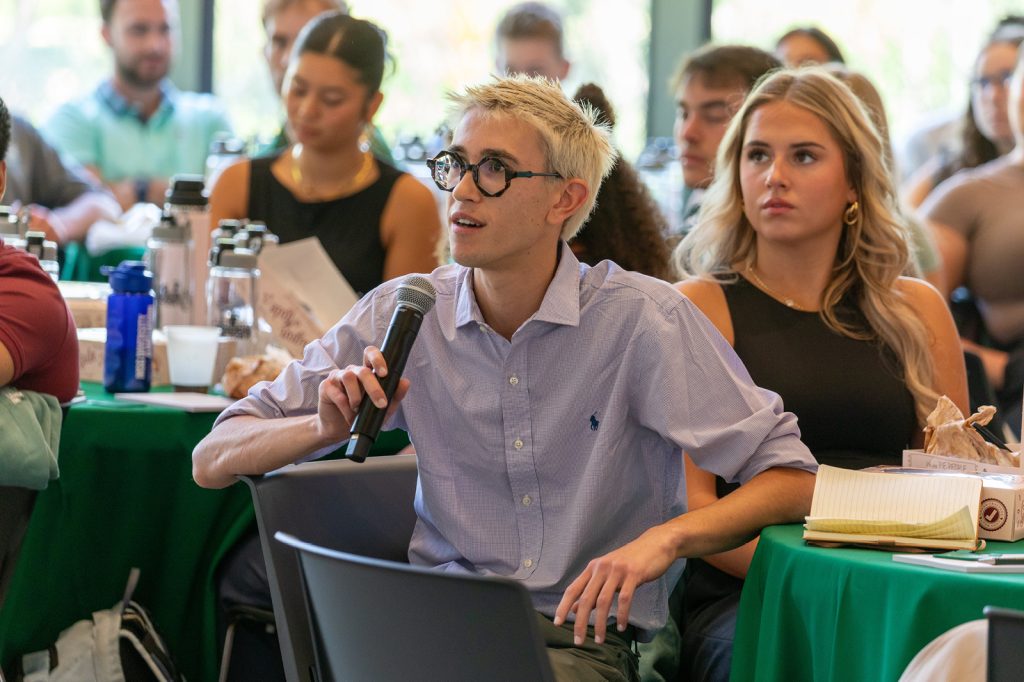
Explore career paths, access alumni mentorship and develop the skills to succeed in business on Broad Connect
Fall events support the Broad experience and give students opportunities to build skills and networks
Contact Information
- Russell Palmer Career Management Center
- Minskoff Pavilion
- 651 N Shaw Ln Rm M120
- East Lansing, MI 48824
- palmer@broad.msu.edu
- Phone: (517) 432-0830
- Follow us on LinkedIn
- Follow us
- TikTok
- Follow us
- Assistant Dean, Career Management
- Marla McGraw
- mcgrawm4@broad.msu.edu
- Phone: (517) 432-0830
- Business Manager
- Tresha Crenshaw
- crensh26@broad.msu.edu
- Phone: (517) 432-5116
- Senior Associate Director, Career Coaching & Education
- Jacob Winston-Galant, MBA, MEd, & MPP
- winston8@broad.msu.edu
- Phone: (517) 355-6535
- Senior Associate Director, Consulting Career Initiatives
- Adam Merrill
- merri143@broad.msu.edu
- Phone: (517) 331-3299
- Associate Director, Career Coaching & Education, Undergraduate Lead
- Kristen Hintz
- hintzk@broad.msu.edu
- Phone: (517) 432-7060
- Associate Director, Career Coaching & Education, Graduate
- Pam Mars
- pmars@broad.msu.edu
- Phone: (517) 432-3681
- Associate Director, Career Coaching & Education, Graduate
- Paul Edwards
- edward48@broad.msu.edu
- Phone: (517) 432-6161
- Lead Associate Director, Global Career Initiatives
- Kelsey Fedewa
- fedewak6@broad.msu.edu
- Phone: (517) 432-0931
- Associate Director, Global Career Initiatives
- Jenny DuChene
- duchene4@broad.msu.edu
- Phone: (517) 432-8010
- Associate Director, Global Career Initiatives
- Sanfeng Miao
- miaosanf@broad.msu.edu
- Phone: (517) 432-6161
- Associate Director, Career Coaching & Education, Undergraduate
- Lauren Hinkel
- hinkell2@broad.msu.edu
- Phone: (517) 432-6161
- Senior Associate Director of Employer Relations
- Kristina Reitler, MS, CMP
- baxenda1@broad.msu.edu
- Phone: (517) 432-6272
- Events/Communications Manager, Employer Relations
- Taylor Bates, CMP
- taybates@broad.msu.edu
- Phone: (517) 432-8009
- Recruiting Manager, Employer Relations
- Penni Vandecar
- vandecar@broad.msu.edu
- Phone: (517) 432-6500
- Curriculum Developer & Data Analyst
- Korin Visocchi
- coxkorin@broad.msu.edu
- Phone: (517) 353-2410